

Data Analysis
Power BI
In this course you will learn:
- The difference between excel sheets and power BI.
- Connecting your data on power BI.
- The different types of relations on power BI.
- How to use Dashboards and slicers in a flexible way.
- How to manage the relations and visualize your data on the form of boards.
This course is for a person who wants to learn how to deal with power BI to analyze their data and document it in a more effective and easy way. Through taking all the tips on the program starting from understanding the layout all the way to visualization.
-
Intro
2 minutes 27 seconds -
Power BI Layout
2 minutes 8 seconds -
Data Model and Relations
6 minutes 12 seconds -
Power BI Visual
9 minutes 26 seconds -
Dynamic Dashboard and Slicers
14 minutes 4 seconds -
Power BI Service
14 minutes 5 seconds
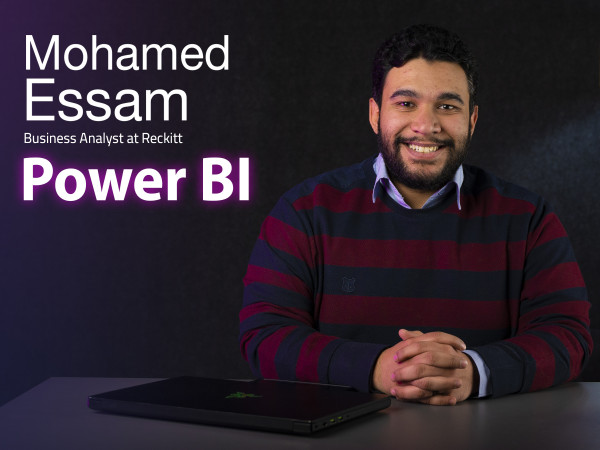
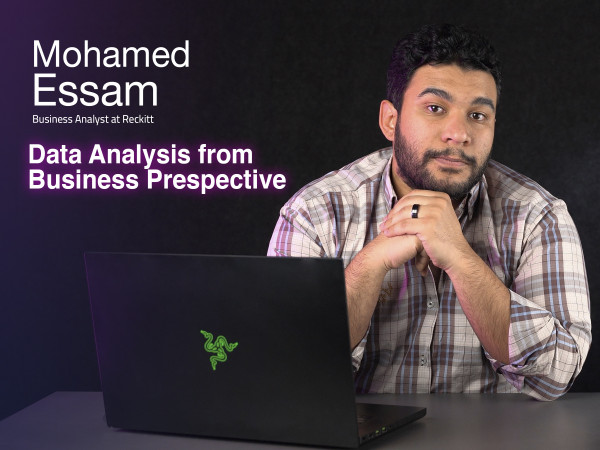
Meet your instructor

Mohamed Essam
I'm a highly experienced Data Analyst with an
Engineering background. I'm an IT Business Analyst at Reckitt Benckiser.
I became certified by Microsoft in Data Analyzing & Visualization
after being certified in Project Management from the University of
California and Advanced Excel for Business by Macquarie University. I
earned a scholarship in the Next Technology Leaders (NTL) and African
App Launchpad (AAL) in Programming for Data Science with Python
Nanodegree and Data Analyst Nanodegree, after which I earned another
full scholarship in the Advanced Data track sponsored by the Information
Technology Industry Development Agency (ITIDA), FWD and managed by
Udacity and its global leading technology partners!
Furthermore,
I'm a certified trainer in which I trained 15+ Entity for 1400+ Trainee
across 5 different countries making 500+ Training Hours. I believe the
future relies on taking smart business decisions and coming up with
accurate insights about your business based on smart data analysis in
order to improve operational processes and seize better business
opportunities which will lead to higher efficiency and value.




Subscriptions
Start watching our recorded courses in different fields with our great experts
1 Month Subscription
Benefits
- Full access to all courses
- Full access to material of courses
- Engage with course instructors
- Get certificate of completion
1 Year
Benefits
- Full access to all courses
- Full access to material of courses
- Engage with course instructors
- Get certificate of completion
3 Months
Benefits
- All one month subscription perks
- Access for three months
- Access for 3 users